
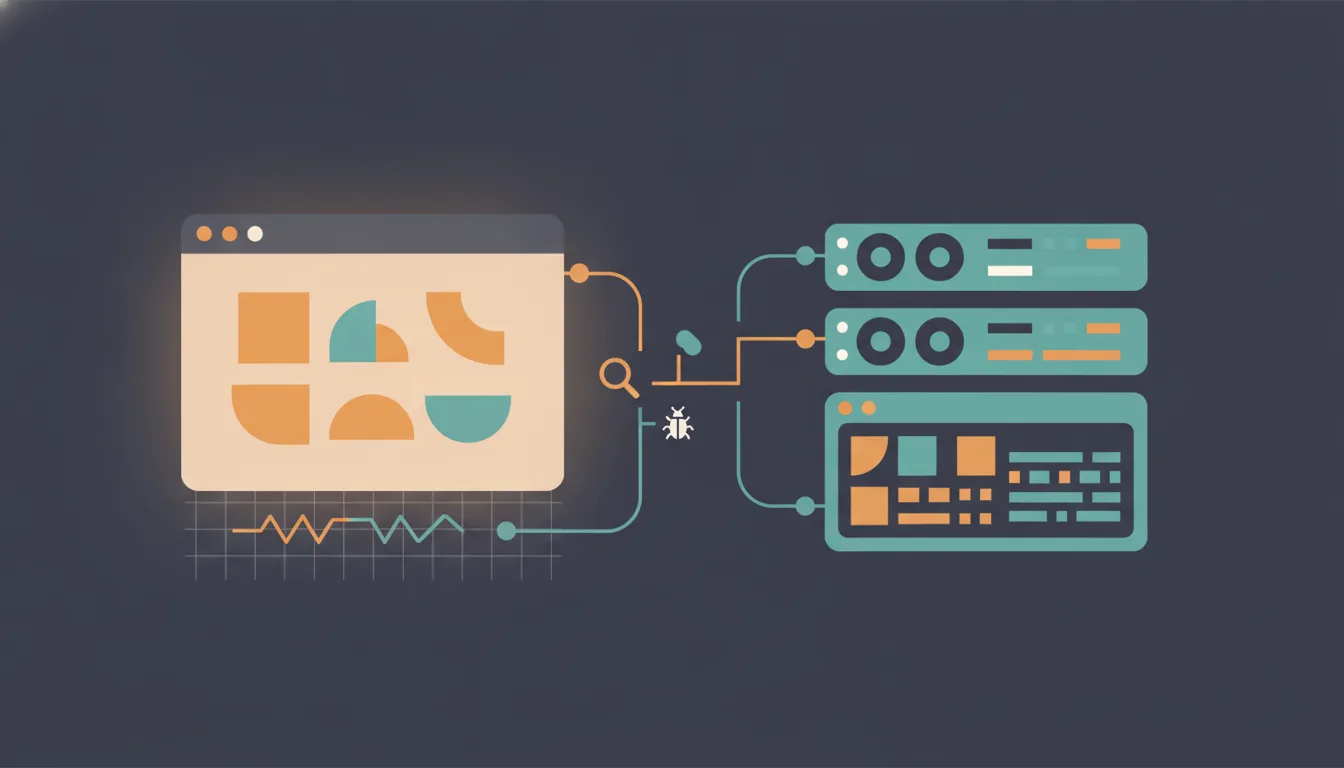
Debugging a React single-page application (SPA) and debugging a Next.js App Router app are different sports, and the whole difference comes down to one thing: where your code runs. This is a recipe-oriented reference for the questions that keep coming up — where your logs went, how to see backend calls, how to observe React Server Components (RSC), and which logging options and tools are worth reaching for.
The one idea everything hangs off
Where the code runs decides where you can observe it. Get this straight and every recipe below becomes obvious.
A React SPA built with Vite has one runtime — the browser — so there is one place to look. A Next.js App Router app has two: Server Components, Route Handlers, and Server Actions run on the server (Node.js or edge), while Client Components (marked "use client") render on the server for the first paint, then hydrate and run in the browser.
| React SPA (Vite) | Next.js App Router | |
|---|---|---|
| Runtimes | One — the browser | Two — server + browser |
| Where app code runs | Browser only | Server for Server Components / Route Handlers / Server Actions; browser for Client Components (after hydration) |
| Where you observe it | Browser Developer Tools (DevTools) | Terminal for the server side, browser for the client side |
| Debugging surface |
The single most common confusion — "where did my console.log go?" — is just this idea biting you. If a log or a network call isn't where you expected, it ran on the other side.
Recipe 1 — Debug a React SPA (Vite + React + TypeScript)
Everything is in the browser, so the browser is your whole toolbox.- Network tab — every
fetch/XMLHttpRequest(XHR) to your backend Application Programming Interface (API) is visible, with payloads, headers, and timing. This is the complete picture of your backend calls; nothing is hidden server-side. - React Developer Tools (DevTools) — component tree, props/state inspection, and the Profiler for render performance.
- Sources panel — set breakpoints, or drop a
debuggerstatement;console.loglands in the browser console.
Because there's a build step (Vite → esbuild/Rollup), breakpoints rely on source maps to map bundled output back to your .tsx. They're on in dev by default; if breakpoints sit grey/hollow ("unbound"), it's almost always a source-map path mismatch.
In an SPA, if you can't find something, you're just not looking in the right browser panel — it's never "on the server," because there is no server-rendered application code.
Recipe 2 — Debug Next.js: know your two runtimes first
Before any tooling, classify the code you're debugging:
| Code | Runs where | Observe it with |
|---|---|---|
| Server Component (default) | Server | Terminal logs, --inspect, fetch logging |
Route Handler (route.ts) | Server | Terminal logs, --inspect |
Server Action ("use server") | Server (invoked via a browser POST) | Terminal logs + Network tab for the POST |
Client Component ("use client") | Server first render → then browser | Browser DevTools (after hydration) |
Once you know which column you're in, pick the matching recipe below.
Recipe 3 — "My console.log disappeared"
The classic. A console.log inside a Server Component prints to the terminal running next dev, not the browser console. If a log vanished, it ran server-side.
Two fixes depending on what you want:
A. Just find the log. Check the terminal first. If it's there, the code is server-side — done.
B. Unify both sides in the terminal. Next.js can forward browser console output to the dev terminal. This started life as the experimental browserDebugInfoInTerminal flag (introduced in 15.4, explicitly aimed at AI-assisted debugging workflows where an agent watches one stream) and graduated to a stable logging.browserToTerminal option in 16.2:
// next.config.js
module.exports = {
  logging: {
    // true = forward all console output; 'warn' = warnings + errors; 'error' = errors only
    browserToTerminal: true,
  },
}
Now a console.log in a Client Component's onClick prints to the terminal too, tagged and with source location:
[browser] Hello World (app/page.tsx:8:17)
Caveats: it's dev-only. On older releases (15.4–16.1) the option lives under experimental.browserDebugInfoInTerminal and takes fine-tuning sub-keys (depthLimit, edgeLimit, showSourceLocation); the stable browserToTerminal takes true | 'warn' | 'error' | false. Some versions resolve the source location to .next chunks instead of your app file — if logs point at forward-logs-shared instead of your file, check Chrome DevTools' ignore-list setting, which interferes with source mapping.
Recipe 4 — See the backend calls an RSC makes
This is the real friction with the App Router. When a Server Component does await fetch(...) or hits Prisma, that call happens on the server, so it never appears in the browser Network tab.
What you do see in the browser is the initial document request, and on client navigation, requests carrying a ?_rsc=… param / RSC: 1 header whose response is the serialized RSC ("Flight") payload (text/x-component). That's the server's rendered output — not the underlying fetches.
To see the actual fetches, turn on Next.js's fetch logging:
// next.config.js
module.exports = {
  logging: {
    fetches: {
      fullUrl: true,      // log the complete URL, not just the path
      hmrRefreshes: true, // also log fetches restored from the Hot Module Replacement (HMR) cache
    },
  },
}
Every server-side fetch now prints to the terminal with its URL and cache status (HIT/MISS/SKIP), e.g.:
GET / 200 in 1554ms
 │ GET https://api.example.com/blog 200 in 244ms (cache skip)
 │ │ Cache skipped reason: (auto no cache)
The cache status is a bonus — accidental caching (or accidental no caching) becomes visible immediately.
With NODE_OPTIONS='--inspect' next dev, these fetch logs show in the terminal but not in the DevTools console you attached — that inspector session belongs to the router server process. Don't waste time hunting for them in DevTools.
Recipe 5 — See Server Action calls
Server Actions are a middle case. Invoking one does produce a POST in the browser Network tab (to the current route, with a Next-Action header) — but the logic runs server-side.
- Browser Network tab: inspect the request/response of the POST.
- Terminal: see what actually happened inside. Action invocations are logged by default in dev, showing name, arguments, and duration:
POST /
└─ ƒ myAction(arg1, arg2) in 5ms
Silence them if noisy:
// next.config.js
module.exports = { logging: { serverFunctions: false } }
Recipe 6 — The full Next.js logging config
All dev-only; none of it affects production builds. One block to know:
// next.config.js
module.exports = {
  logging: {
    fetches: {
      fullUrl: true,        // complete URLs for server fetches
      hmrRefreshes: true,   // include HMR-cached fetches
    },
    serverFunctions: true,  // Server Action calls (default true; false to hide)
    incomingRequests: {
      ignore: [/\/api\/health/], // filter noisy routes (polling, health checks)
    },
    // incomingRequests: false, // or disable incoming-request logs entirely
    browserToTerminal: true,   // forward browser console output (16.2+)
  },
  // logging: false,        // nuke ALL dev logs
}
With fetches.fullUrl + incomingRequests + serverFunctions on (and browserToTerminal from Recipe 3), your terminal becomes a single unified view: incoming requests, server fetches with cache status, Server Action calls, and browser console output. That collapses the annoying server/client split into one stream.
Recipe 7 — Set breakpoints in Next.js (VS Code)
In Visual Studio Code (VS Code), create .vscode/launch.json. The official config gives you three independent targets — front end, back end, or both:
{
  "version": "0.2.0",
  "configurations": [
    {
      "name": "Next.js: debug server-side",
      "type": "node-terminal",
      "request": "launch",
      "command": "npm run dev -- --inspect"
    },
    {
      "name": "Next.js: debug client-side",
      "type": "chrome",
      "request": "launch",
      "url": "http://localhost:3000"
    },
    {
      "name": "Next.js: debug full stack",
      "type": "node",
      "request": "launch",
      "program": "${workspaceFolder}/node_modules/next/dist/bin/next",
      "runtimeArgs": ["--inspect"],
      "skipFiles": ["<node_internals>/**"],
      "serverReadyAction": {
        "action": "debugWithChrome",
        "killOnServerStop": true,
        "pattern": "- Local:.+(https?://.+)",
        "uriFormat": "%s",
        "webRoot": "${workspaceFolder}"
      }
    }
  ]
}
Notes that save real time:
debugWithChromevsdebugWithEdge— the docs default to Edge; switchactiontodebugWithChromeif that's your browser.- Monorepo / non-root (Turborepo, etc.) — add
"cwd": "${workspaceFolder}/apps/web"to the server-side and full-stack configs. - Turbopack + breakpoints not binding — a recurring pain; try temporarily running without Turbopack to confirm it's the cause.
--inspect-brk/--inspect-waitneedNODE_OPTIONS, e.g.NODE_OPTIONS=--inspect-brk next dev.- Docker — use
--inspect=0.0.0.0to allow the debugger in from outside the container. - Manually:
NODE_OPTIONS='--inspect' next dev, then attach viachrome://inspect. On the Next.js error overlay, a Node.js icon copies the DevTools URL for the server process to your clipboard. - When searching files for manual breakpoints (Ctrl/⌘+P), server source paths start with
webpack://{app-name}/./.
Recipe 8 — Debug database calls (Prisma) — fetch logging won't catch these
Prisma queries aren't fetch calls, so logging.fetches is blind to them. Use Prisma's own logging to print the Structured Query Language (SQL) it runs:
const prisma = new PrismaClient({
  log: ['query', 'warn', 'error'], // prints SQL + params to the terminal
})
For anything else non-fetch (a database driver, a message queue), fall back to a plain console.log on the server or a breakpoint via --inspect.
Recipe 9 — Production observability (when dev logging isn't available)
Next.js's built-in logging is dev-only by design — the maintainers push back on production request logging because it's I/O that competes with serving requests. The sanctioned paths:
- OpenTelemetry (OTel) via
instrumentation.ts(@vercel/otel) — traces server work including outbound calls; can even export spans to the console if you want a quick look. - Structured logger (
pino) inside the request lifecycle for the business events you actually care about — third-party calls, important state changes, failures — rather than logging every request.
// instrumentation.ts
import { registerOTel } from '@vercel/otel'

export function register() {
  registerOTel({ serviceName: 'slotflow' })
}
Recipe 10 — Debug Vitest tests (Node and Browser Mode)
Squarely in the Vite/Vitest stack, and Browser Mode has a twist worth knowing.
Node tests — the quick way: open a JavaScript Debug Terminal in VS Code and run npm run test (or vitest). It auto-attaches and source maps work out of the box; no launch config needed. Add --test-timeout so tests don't time out while paused on a breakpoint.
Node tests — headless Command-Line Interface (CLI): debugging requires tests to run non-parallel:
vitest --inspect-brk --no-file-parallelism
Vitest stops and waits for a debugger; open chrome://inspect to attach.
Browser Mode — the twist: a debugger in a browser-mode test does nothing if you launched via npm test, because tests spawn in Node.js while the statement evaluates in the browser — two processes. You connect them with a compound launch config that runs the tests and attaches Chrome DevTools to the browser process:
{
  "version": "0.2.0",
  "configurations": [
    {
      "type": "node-terminal",
      "name": "Run Vitest Browser",
      "request": "launch",
      "command": "npm test -- --inspect-brk --browser --no-file-parallelism"
    },
    {
      "type": "chrome",
      "request": "attach",
      "name": "Attach to Vitest Browser",
      "port": 9229
    }
  ],
  "compounds": [
    {
      "name": "Debug Vitest Browser",
      "configurations": ["Attach to Vitest Browser", "Run Vitest Browser"],
      "stopAll": true
    }
  ]
}
Default inspector port is 9229; override with --inspect-brk=127.0.0.1:<port>. The Vitest VS Code extension also shows console.log inline next to the producing line, which often removes the need to debug at all.
Recipe 11 — Browser plugins worth installing
- React Developer Tools — component tree + Profiler. Works on Client Components after hydration. Newer versions surface Server Components distinctly, but there's still no great way to inspect the server-side RSC tree in the browser (by the time it arrives it's a serialized Flight payload, not live components).
- Redux DevTools — if you're on Redux; time-travel and action inspection.
- Plain DevTools Network tab filtered to
?_rsc=/RSC: 1— the closest thing to "watching RSC traffic" on the client.
The takeaway for RSC: no browser plugin sees the server's fetches. That's why logging.fetches + browserToTerminal (Recipes 4 and 3) are the real answer for RSC observability, not an extension.
Cheat sheet — "I can't find X"
| Symptom | Where it actually is | Recipe |
|---|---|---|
console.log missing from browser console | Terminal (it's a Server Component) | 3 |
fetch from a page not in Network tab | Server-side; enable fetch logging | 4 |
| Prisma/SQL query not in fetch logs | Not a fetch; use Prisma log | 8 |
A POST with Next-Action header appears | Server Action; logic is server-side | 5 |
| Breakpoint grey/hollow ("unbound") | Source-map path mismatch (or Turbopack) | 7 |
| Server fetch logs not in attached DevTools | They're in the terminal, not DevTools | 4 |
| Browser-mode Vitest breakpoint ignored | Wrong process; need compound attach config | 10 |
Log points to forward-logs-shared | Chrome DevTools ignore-list setting | 3 |
--inspect) is where you look. In a plain React SPA, it's always in the browser somewhere.
References
- Next.js —
loggingconfig (fetches,serverFunctions,incomingRequests,browserToTerminal) - Next.js —
browserDebugInfoInTerminal(experimental predecessor ofbrowserToTerminal) - Next.js 15.4 release notes (browser log forwarding)
- Next.js — Debugging guide (
.vscode/launch.json,--inspect) - Next.js — OpenTelemetry /
@vercel/otel - Vitest — Debugging guide
- Vitest — Browser Mode
- Vitest VS Code extension
- Prisma Client — Logging
- Pino — structured logger